
Ask a Year 6 class this: "I've rolled a 3 four times in a row. What's the chance my next roll is a 3?" You'll usually get three camps. Some say it's less likely now, because the 3s are "used up". Some say it's more likely, because the die is on a streak. A smaller group says it's still 1/6, and one or two will add that the die can't remember what it did.
Students arrive in Stage 3 with lots of ideas about luck. The job is to turn those ideas into numbers and then test them.
What the syllabus asks for
Stage 3 has one chance outcome, MA3-CHAN-01: "conducts chance experiments and quantifies the probability".
Chance A covers using the term probability for the number that describes likelihood, equally likely outcomes, recording all the outcomes, writing probabilities as fractions, showing that the probabilities of all the outcomes add to one, and the imprecise meaning of chance words like possible, likely and unlikely.
Chance B covers frequency versus probability, comparing expected and observed frequencies (including when outcomes aren't equally likely), fairness and randomness, and creating random generators to match given probabilities, with denominators of 2, 3, 4, 5, 6, 8 and 10. Students also use benchmark fractions, decimals and percentages, run experiments with small and large numbers of trials (including digital simulators), and sample with replacement.
Some things belong to Stage 4. NESA's teaching advice says the list of all outcomes is called the "sample space", but the term itself isn't introduced until Stage 4. Complementary events and relative frequency are Stage 4, and so is listing all 36 outcomes for two dice in a table. Two-dice games are good fun, so I keep them as an extension.
The chance scale
I start with a line from 0 to 1: impossible at one end, certain at the other, even chance in the middle. Students place events on it. The day after Thursday being Friday is certain. A coin landing on heads is ½. Snow in Parramatta in January is about as close to impossible as Sydney gets.
Hand the events out on cards and have students defend where they put them. Some should move depending on the day. "Someone in our class wears pyjamas tomorrow" is unlikely on a normal day and likely on Pyjama Day.
If I could keep only one activity, it would be "How likely is likely?" Each student gets a 0% to 100% line for each of the words possible, likely, unlikely and probably, and puts a cross where they think the word belongs. When you compare as a class, the crosses for "likely" are spread right along the line. That's what the syllabus means by the imprecise meaning of chance words. A 70% chance of rain means the same thing to everyone.
From there, bring in the benchmarks: ½ = 0.5 = 50%, ¼ = 0.25 = 25%, ¾ = 0.75 = 75% and 1/10 = 0.1 = 10%. The syllabus example works on the wall as it is: a 5 out of 10, 1/2, 50%, or one out of two chance. The Chance Scale and Memory Game opens with a TV weather forecast board, so the percentages are already there to turn into fractions and decimals.
Listing outcomes and writing probabilities
For one throw of a standard 6-sided die, the outcomes are 1, 2, 3, 4, 5 and 6. Each is equally likely, so each has a probability of 1/6, and the probability of an even number is 3/6. If a student writes ½ instead, ask them to explain both.
Listen for "There are two outcomes, so it's fifty-fifty." Students will apply it to almost anything: you either win or you don't. A spinner with one thin red sector and a huge blue one deals with that quickly.
On an 8-sector spinner with 3 red, 2 yellow and 3 blue sectors, the probabilities are 3/8, 2/8 and 3/8. They add to 8/8, which is 1, because one of those colours has to come up.
Then turn it around and have students make the random generator. "Make a spinner for red, blue and green where red is more likely than the other two." "Put red and blue blocks in a bag so a red block is twice as likely to come out as a blue one." Both are syllabus examples, and you'll soon see who understands the fractions and who's just counting.
Theoretical vs experimental probability
Teachers often search for "theoretical vs experimental probability", but the NSW syllabus uses expected and observed. Expected probability is what you work out from the outcomes. Observed probability is what happens when you run the experiment. I use both pairs of words with students.
Frequency is a separate idea. In the syllabus example, the number of times a fair coin lands on heads in 10 tosses is the frequency of heads, and the probability of heads is 1/2. "The probability of heads was 6" is a sentence you will hear.
This is the investigation I run every year:
- Predict. If we roll a die 30 times, how many 6s do we expect? 1/6 of 30 = 5.
- Test. Pairs roll 30 times and tally.
- Compare. Hardly anyone gets exactly 5 of each number. There's usually a pair with a pile of 4s who decide their die is broken.
- Pool. With 10 pairs, that's 300 rolls and an expected frequency of 50 for each number. The class totals usually sit much closer to 50 than any pair's results sat to 5.
- Graph. A column graph with a many-to-one scale links back to MA3-DATA-01.
NESA's teaching advice says that as the number of trials increases, the observed probabilities tend to become closer to the expected probabilities. Most students can put that in their own words after this lesson.
For large numbers of trials, a spreadsheet makes a simple digital simulator: =RANDBETWEEN(1,6) in a cell, filled down a thousand rows, with =COUNTIF to count the 6s. The Theoretical vs Experimental Probability investigation follows these steps, with tally sheets, pooled class results, a column graph and simulator results to compare.
Not equally likely, and is it fair?
The syllabus spinner is half green, with red, grey and blue sharing the other half, so green is 3/6 and the others are 1/6 each. In 60 spins you'd expect 30 green and 10 of each other colour. Students compare that with what they get.
For fairness, use a fete stall: "Roll a 6, win a prize." The player wins on 1 outcome and the stall wins on 5. Ask students to change the rules so the game is fair, or design one that looks fair but isn't.
Sampling with replacement is a good way to finish. Hide 10 coloured cubes in a paper bag. Students take one out, record the colour, put it back and shake, 40 times, then predict what's in the bag. The Probability Spinner Game includes this mystery bag, along with design-your-own spinners and a clickable spinner on the slides.
Resources that go with this post
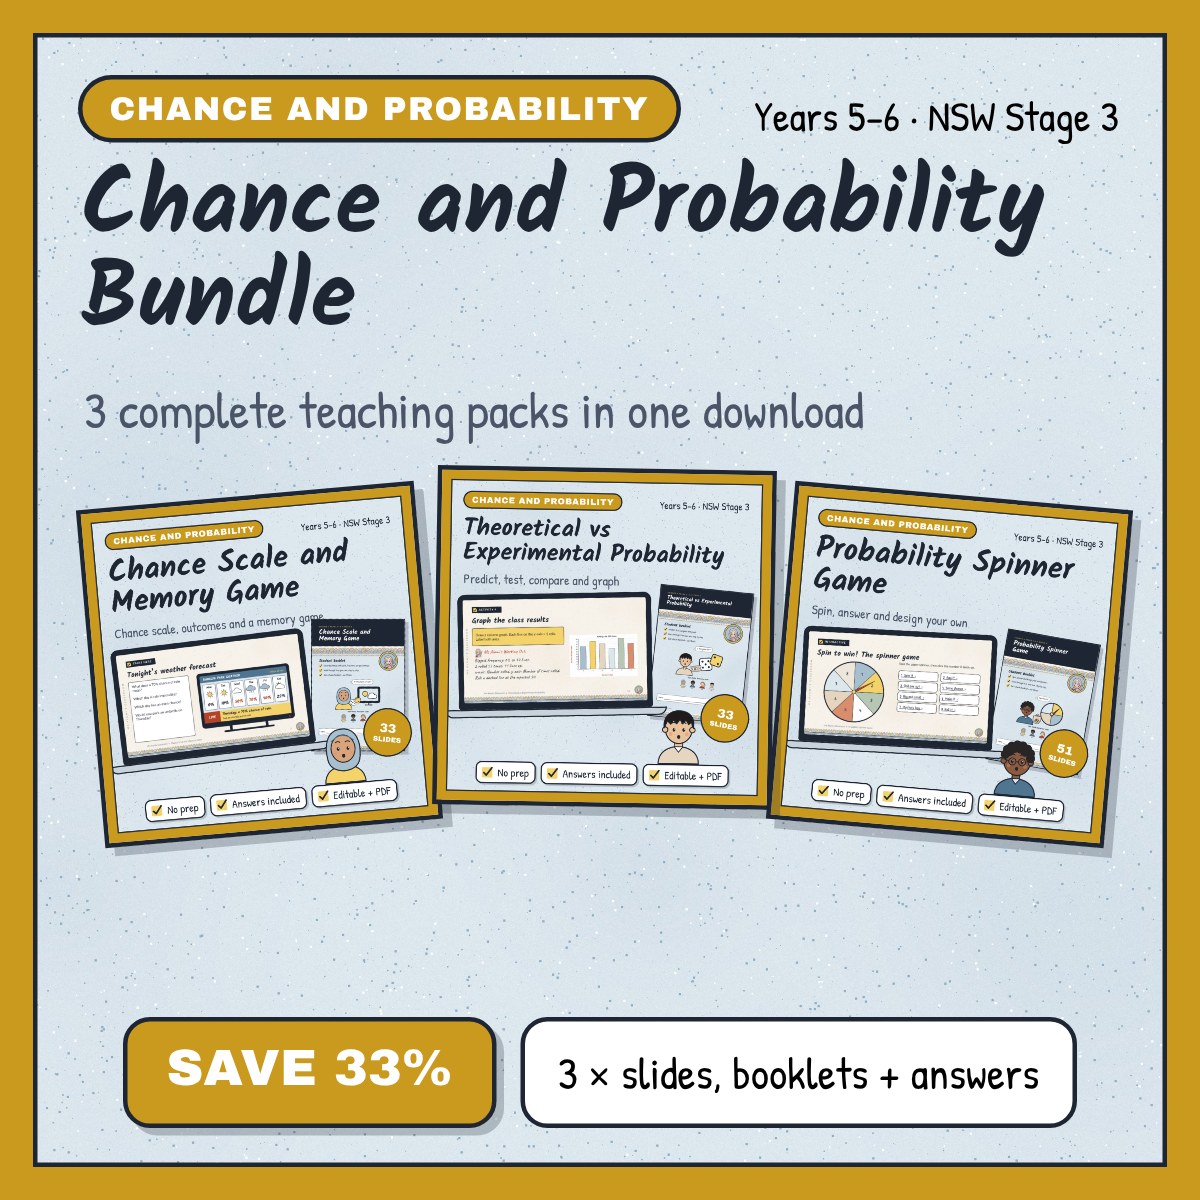
- Chance Scale and Memory Game: a weather board warm-up, a probability scale card sort, "How likely is likely?", benchmark fractions and a memory game.
- Theoretical vs Experimental Probability: predict, roll, pool and graph, an unequal spinner, fair games and a two-dice extension (Stage 4).
- Probability Spinner Game: 8 clickable question slides with worked answers, spinner design, the mystery bag and a two-dice extension (Stage 4).
- Chance and Probability Bundle: all three together.