4 preview pages
Side-by-side column and line graphs
$5.00
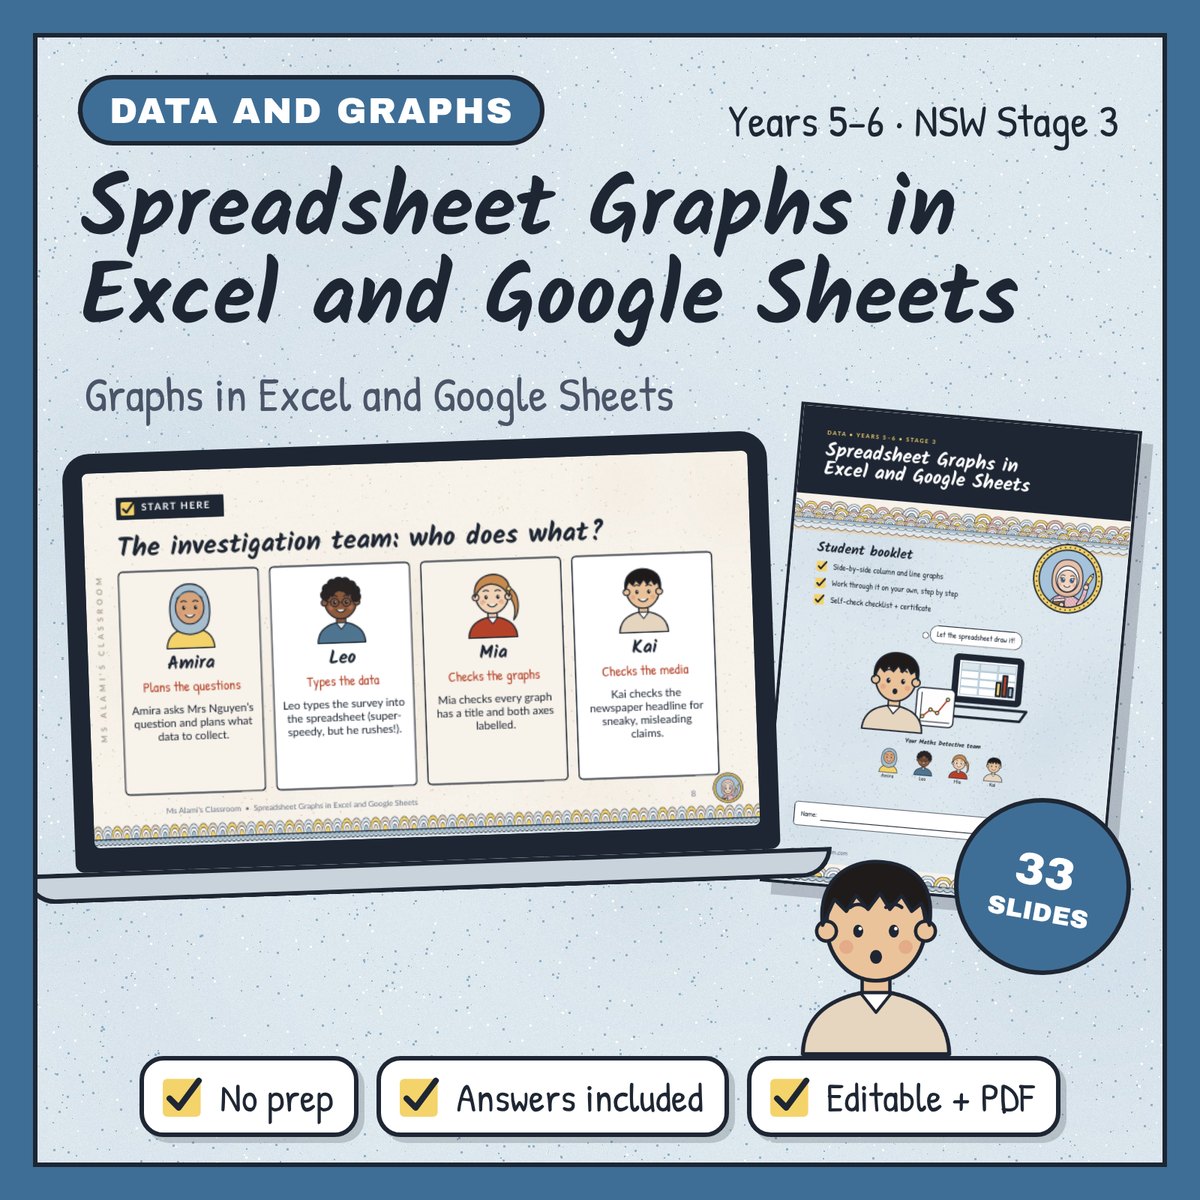
The P&C is saving $1,800 for a bike rack, and Mrs Nguyen, the principal, wants to know whether students will use it. Her email arrives with a spreadsheet attached, and your class becomes the investigation team. Students plan a survey question, enter data in Excel or Google Sheets, make graphs and work out what they show.
Three to four lessons of 45–60 minutes, plus the assessment task. Students learn the parts of a spreadsheet and =SUM, then follow instructions written for both Excel and Google Sheets. They make a side-by-side column graph and check it with Mia's checklist: title, both axes labelled, a key, equal jumps. The spreadsheet draws the columns, but it won't write "Number of students" on the axis for them.
No reviews yet. Bought this resource? You can leave a review from your download page.
They find the step missing from Leo's instructions and write their own. Then come a bike rack savings goal, a playground temperature line graph and a newspaper story for Kai. The paper's y-axis doesn't start at zero, so car trips look as if they doubled. In the Case of the Vanishing Bikes, Leo's typing slip makes bike riding shoot up in winter. A two-page library books assessment task with a P/M/I self-assessment closes the unit.
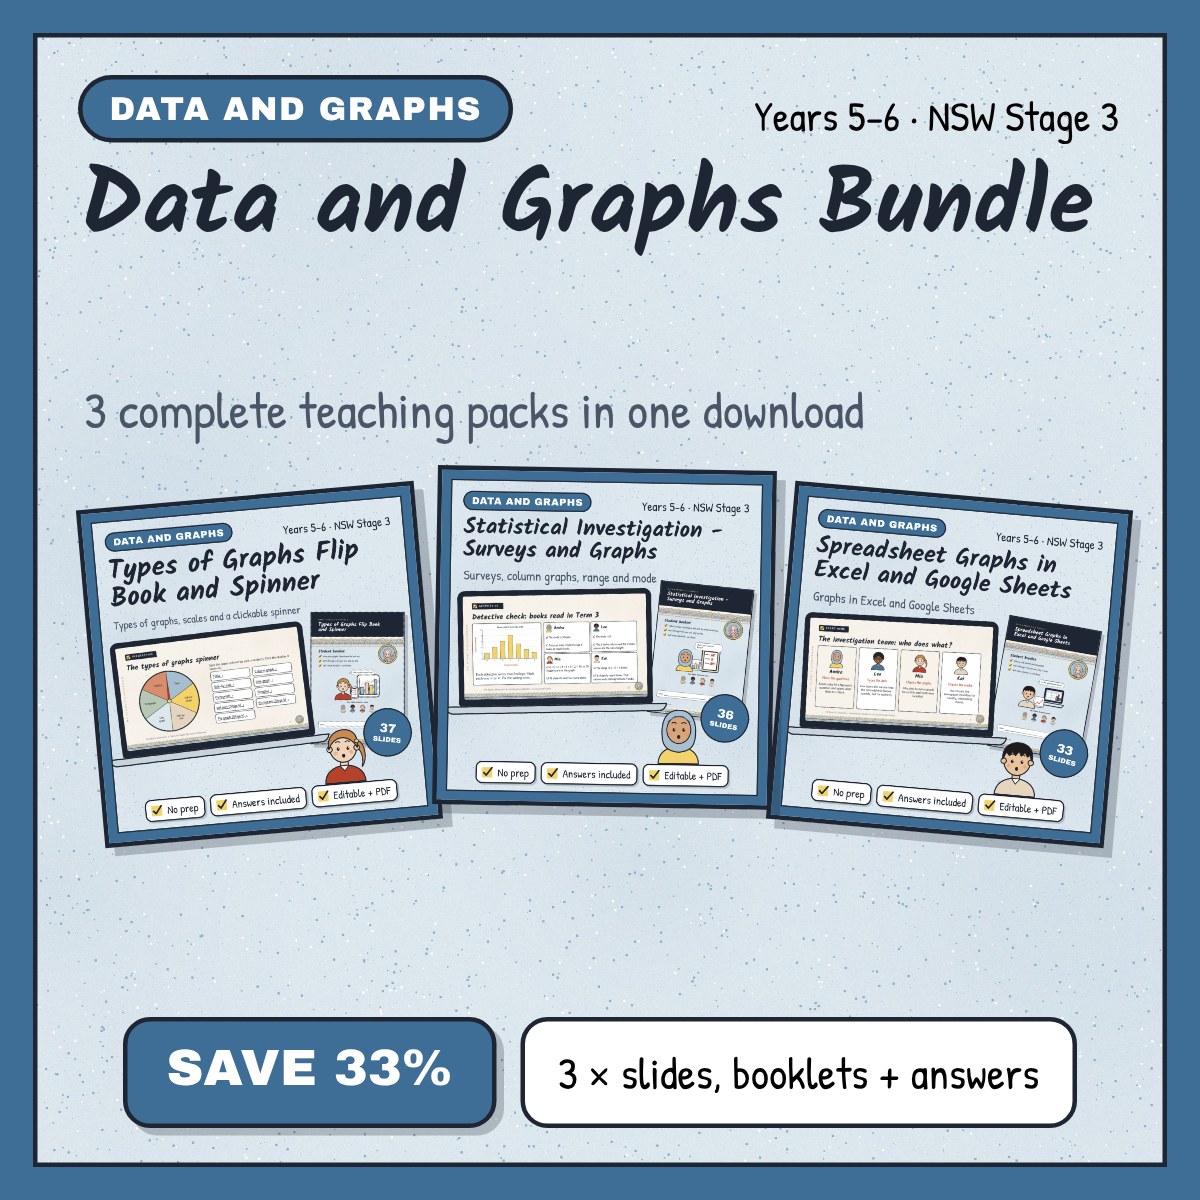
Years 5-6, Mathematics
$10.00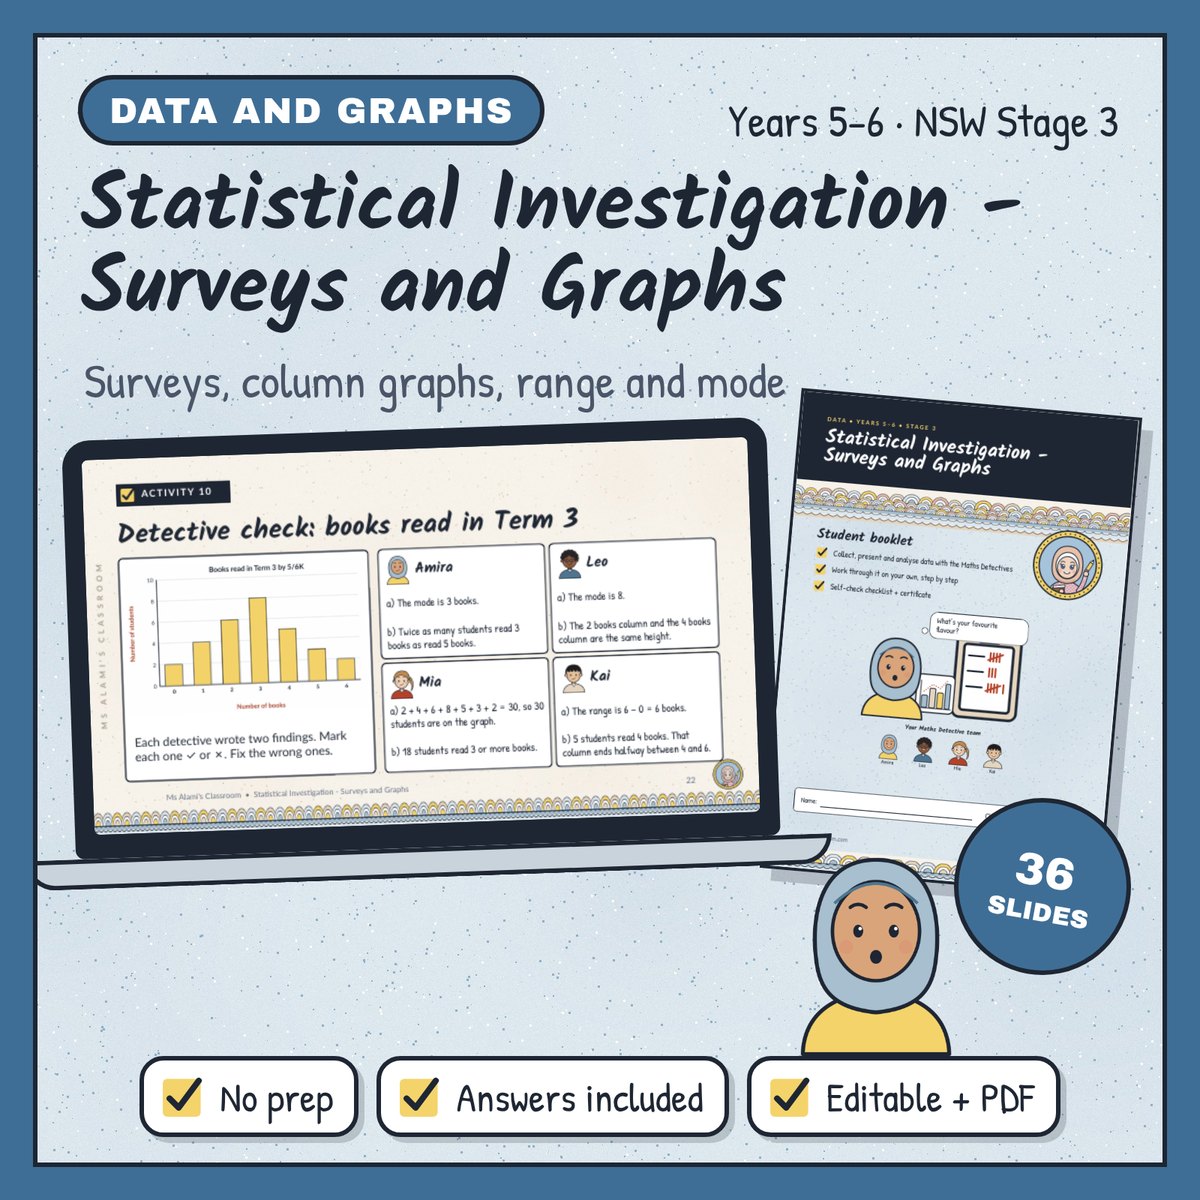
Years 5-6, Mathematics
$5.00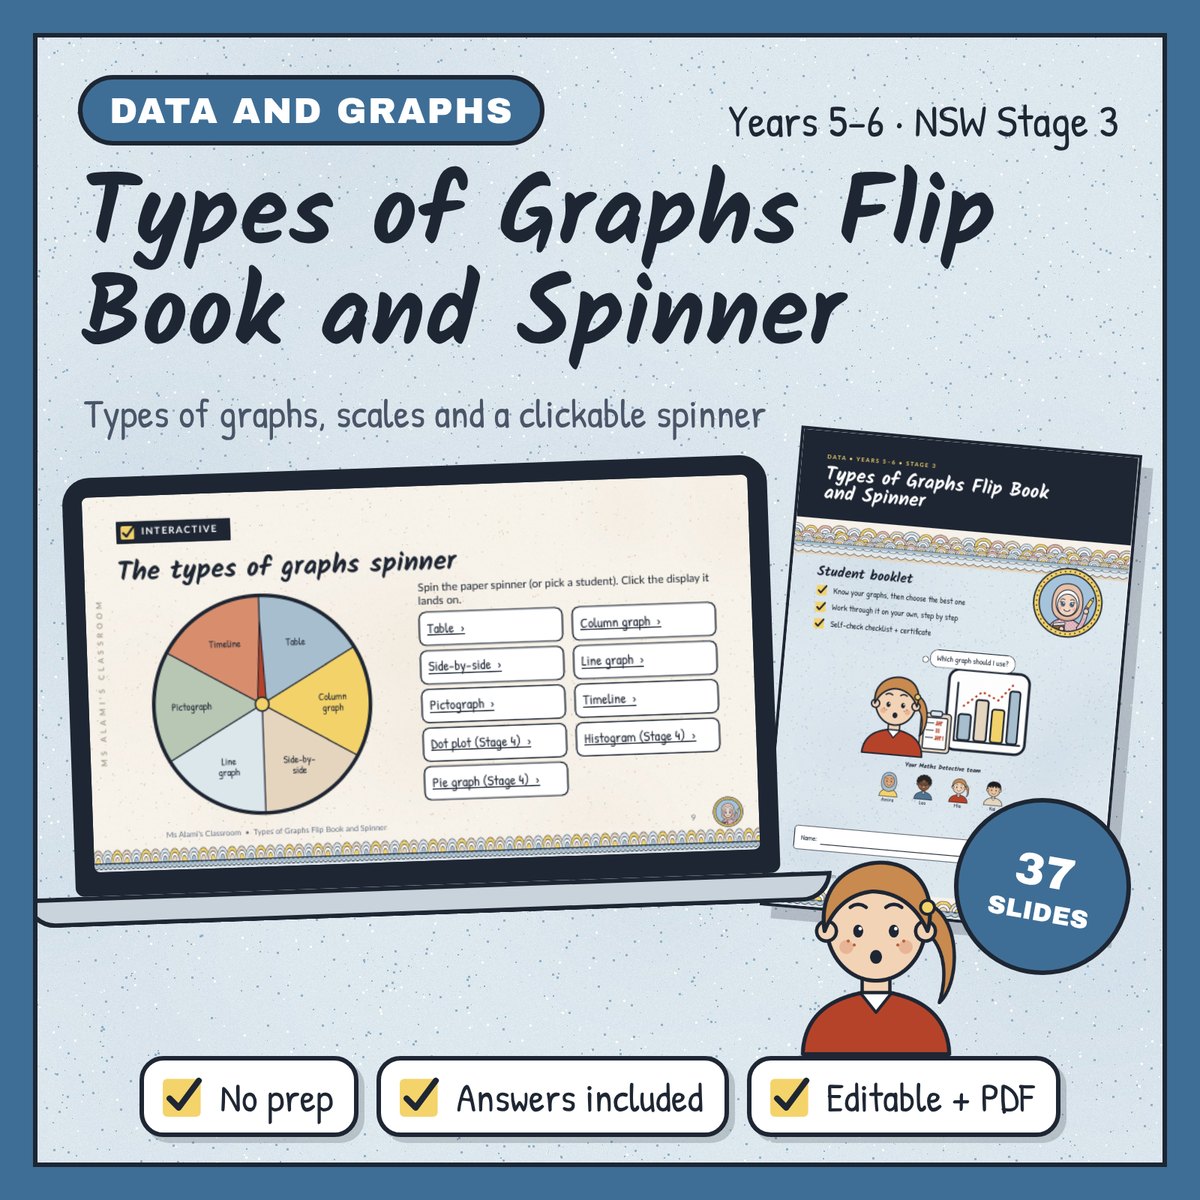
Years 5-6, Mathematics
$5.00