4 preview pages
Collect, present and analyse data with the Maths Detectives
$5.00
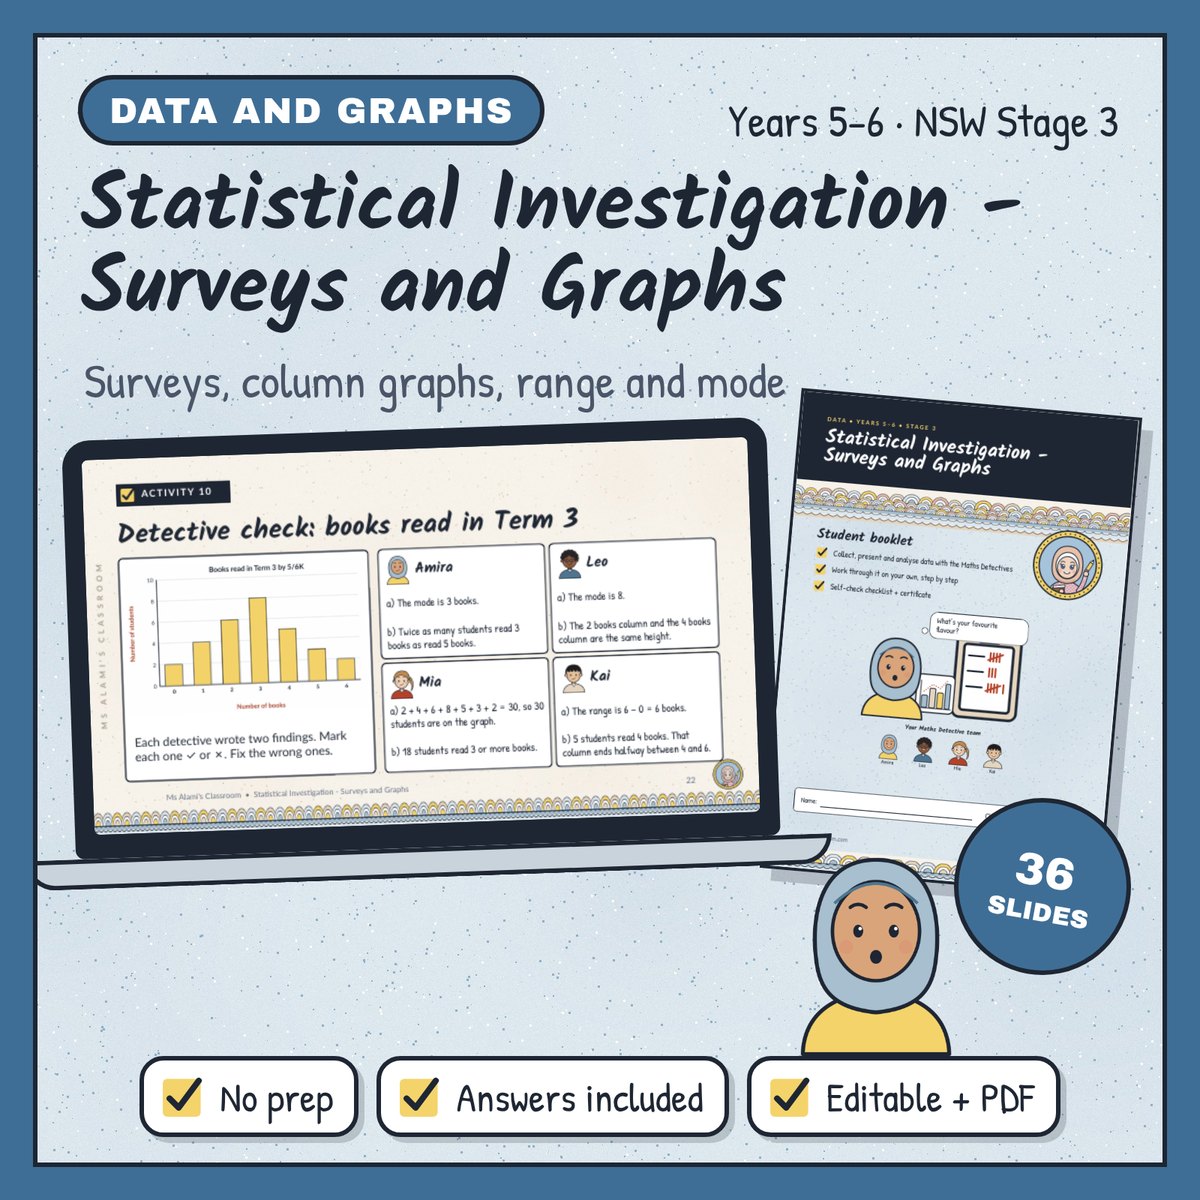
The SRC wants to know the school's favourite ice-cream flavour, and your class is going to find out. That sticky note on a survey clipboard starts a full Collect, Present, Analyse unit: writing and refining survey questions, tallying, drawing column and side-by-side column graphs with a many-to-one scale, and describing the data with range, mode, totals and shape.
Four to five lessons of 45–60 minutes, built around three investigations. Amira's ice-cream survey comes with a savings goal. Leo tallies how many pets each student has and comes out one short of the class total, so students check their own tally to find his slip. Mia compares Year 5 and Year 6 movie choices on a side-by-side column graph.
No reviews yet. Bought this resource? You can leave a review from your download page.
In the Detective check, students mark each detective's findings and fix the wrong ones. Watch for students who give the mode as the height of the tallest column rather than the value under it. The unit ends with a temperature line graph, Kai's page on bias in the media and the Case of the Giant Ice-Cream Cone, a shop poster claiming one brand is "twice as popular".
Years 5-6, Mathematics
$10.00
Years 5-6, Mathematics
$5.00
Years 5-6, Mathematics
$5.00