4 preview pages
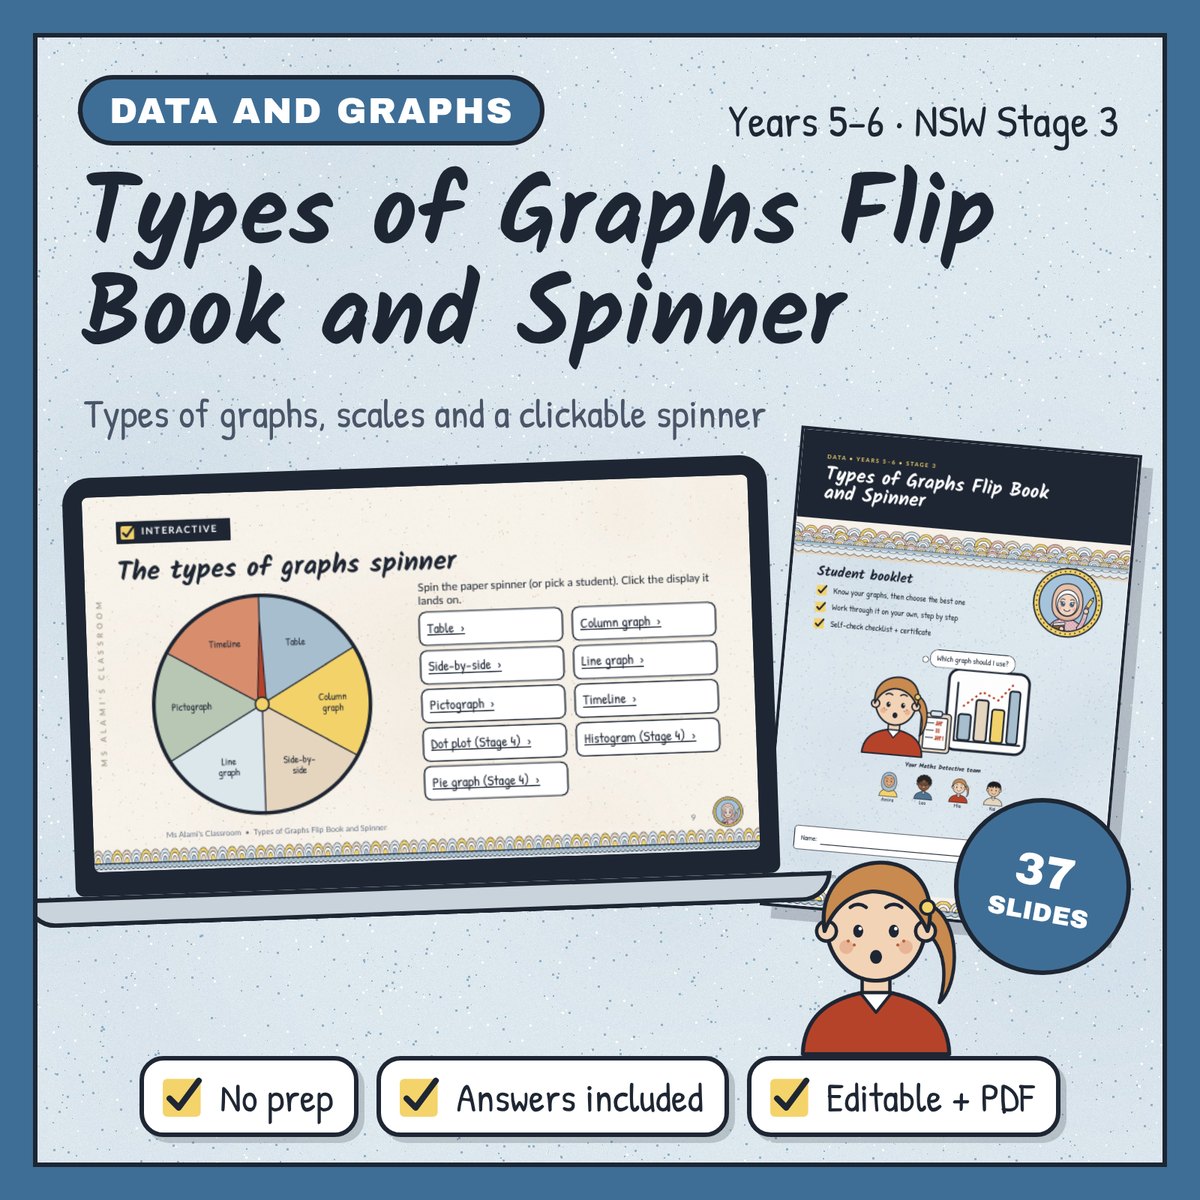
Know your graphs, then choose the best one
$5.00
Ask a Year 5 class how to show a bean plant's growth and someone will suggest a picture graph. This resource is about choosing the display that suits the data, then drawing it properly. It covers tally tables, column graphs, side-by-side column graphs, line graphs, picture graphs and timelines, starting from a Maths Week noticeboard.
Three lessons of 45–60 minutes. Teach each display from a clickable spinner slide: in Present mode, click a display name to jump to it and "Back to the spinner" to return (works in PowerPoint, Keynote and Google Slides).
No reviews yet. Bought this resource? You can leave a review from your download page.
Years 5-6, Mathematics
$10.00
Years 5-6, Mathematics
$5.00
Years 5-6, Mathematics
$5.00