
If you've bought from the store before, you might notice it looks a little different. Each resource now has a colour that tells you its maths topic at a glance.
Here's the key:
- Blue: Data and Graphs
- Gold: Chance and Probability
- Green: Volume and Capacity
- Terracotta red: Fractions and Decimals
- Purple: Money and Budgeting
Why colour code?
Teachers usually go looking for a resource in a hurry. It might be the afternoon before a lesson, or a stage planning meeting where someone asks, "Didn't we have a chance game somewhere?" A colour is quicker to spot than a title, so you can scroll past the purple money units when you're after something on volume.
It also makes it easier to see what goes together. The three blue Data and Graphs resources work well as a set, and the five terracotta fraction resources run roughly from a first look at fractions through to review games.
You don't need a colour printer. Every student booklet still comes with a black-and-white PDF for the photocopier.
What's in each colour
Blue, Data and Graphs. The Types of Graphs Flip Book and Spinner, the Statistical Investigation: Surveys and Graphs unit and Spreadsheet Graphs in Excel and Google Sheets. All three are also in the Data and Graphs Bundle.
Gold, Chance and Probability. The Chance Scale and Memory Game, Theoretical vs Experimental Probability and the Probability Spinner Game, or the Chance and Probability Bundle.
Green, Volume and Capacity. The Volume and Capacity Unit, Measuring Volume by Water Displacement and the Converting Litres and Millilitres Chatterbox, or the Volume and Capacity Bundle.
Terracotta red, Fractions and Decimals. Fractions Introduction, Fraction Revisit and three Millionaire trivia games for adding and subtracting, multiplying and dividing fractions. All five are in the Fractions Bundle.
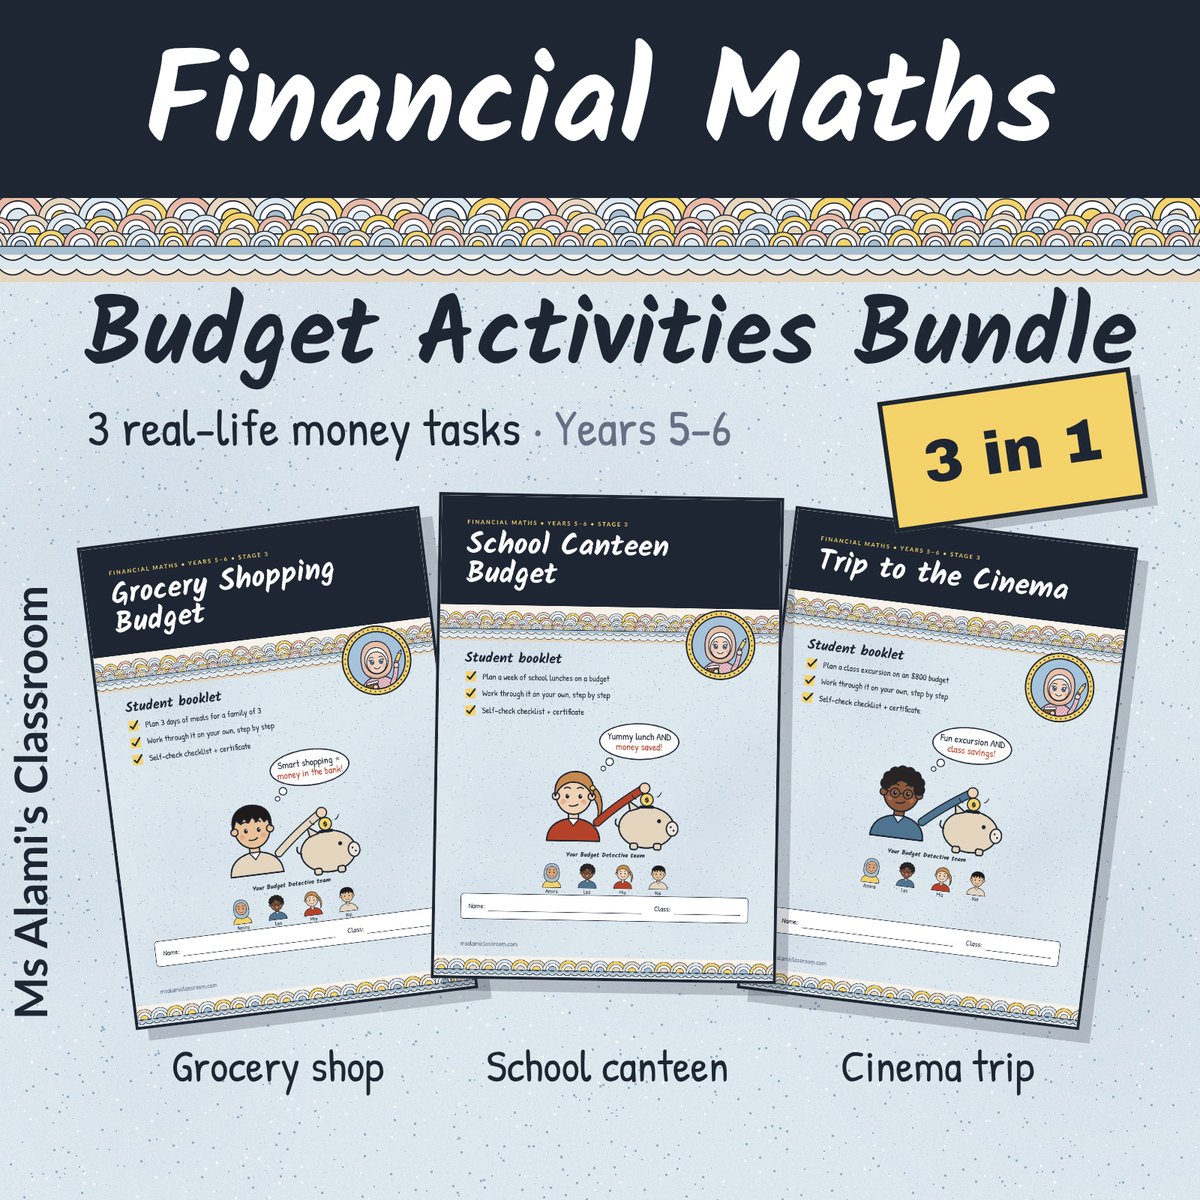
Purple, Money and Budgeting. The School Canteen Budget and Trip to the Cinema activities, or the Budget Activities Bundle. Each one has a savings goal: at least $3 in your piggy bank after the canteen week, and at least $25 in the class piggy bank for the end-of-year party after the cinema trip. The Grocery Shopping Budget, where the goal is to keep at least $10 for the family piggy bank, is free on the free resources page if you'd like to try the format first.
Meet the Maths Detectives
Whichever colour you pick up, you'll see the same four faces. Amira, Leo, Mia and Kai are the Maths Detectives. In the money resources they go by the Budget Detectives. They show the kind of thinking I want from students, and that includes making mistakes.
- Amira asks the best questions. In the data resources she plans the surveys, and she rewrites her survey question when the first one doesn't work.
- Leo is speedy and sometimes rushes. His work is where students find a skipped number on an axis or a slip in the data, and that's on purpose.
- Mia always checks her working. She's the one making sure every graph has a title and both axes labelled.
- Kai spots sneaky mistakes, like a newspaper graph that makes a small change look huge.
Every resource has at least one case file to solve, and most have a Detective check, where students mark the detectives' answers and fix the wrong ones. Students are much fussier about Leo's mistakes than about their own, which is exactly why he makes them.